7 Tips for Choosing the Right CCS Busbar?
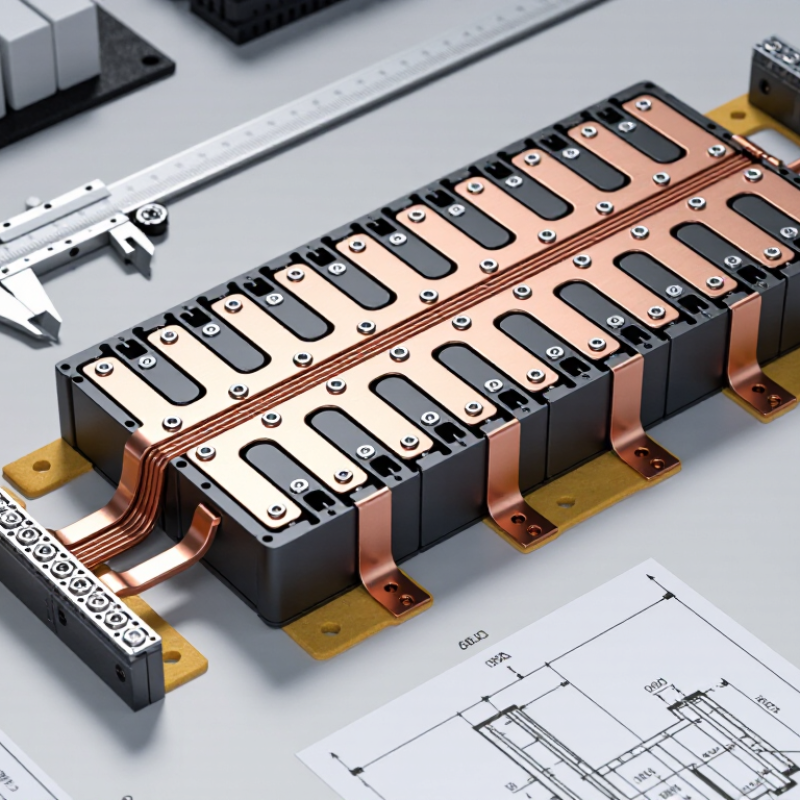
Choosing a CCS Busbar is not a cosmetic decision. In a battery pack, this assembly connects cells and helps carry current through a compact, demanding space. A part that fits the drawing may still struggle with heat, vibration, or assembly tolerances. Small details matter.
This guide explores seven practical considerations: electrical load, material, dimensions, insulation, thermal behavior, connection design, and supplier quality. Each affects a different part of performance. For example, a busbar that handles the expected current on paper may need further review when airflow is limited or nearby components raise temperatures. Check product data, drawings, and relevant test results rather than relying on a single headline rating. When requirements are unclear, involve a qualified battery or electrical engineer.
Fit is only the beginning. A useful review also considers how the CCS Busbar will be manufactured, inspected, and installed. Look closely at bend locations, weld or contact areas, protective films, and clearance around neighboring parts. These details can reveal problems before a prototype reaches the assembly line. Some choices will involve trade-offs, and the best option is not always the most elaborate one. This overview offers a grounded framework for comparing candidates, while leaving room for project-specific testing. No checklist replaces validation. The right decision comes from matching verified specifications to the real pack environment—and revisiting assumptions when the evidence does not fit.
Define CCS Voltage Class Using ISO 6469-3: Up to 1,500 V DC
For a CCS busbar, define the voltage class before comparing materials or dimensions. ISO 6469-3 addresses electrical safety in electrically propelled road vehicles. Its voltage class B range extends above 60 V DC and up to 1,500 V DC. That upper limit is not a recommended operating target. The busbar, insulation system, connectors, and surrounding enclosure must suit the vehicle’s actual maximum working voltage. Do not guess. Check the system specification and the applicable edition of the standard, then confirm how voltage is measured across the assembly.
A practical review should include more than the nominal pack voltage. Consider charging conditions, switching transients, temperature, and the clearances between conductive parts. For example, inspect the narrow gap near a busbar bend, where insulation can be stressed or assembly tolerances can reduce spacing. Confirm that coatings and supports retain their properties under heat and vibration. A rating alone does not prove the complete assembly is safe. It is easy to overlook a small interface detail, and that deserves a second check. Record the voltage assumptions, test conditions, and design margins so suppliers and vehicle engineers are working from the same basis.
Set Peak-Current Limits and Calculate I²R Busbar Heating
Set a peak-current limit from the actual load profile, not a single headline value. Record pulse magnitude, duration, repetition rate, and idle time. A 900-amp pulse lasting milliseconds can heat a busbar differently from the same current held for several seconds. Check the conductor’s material, cross-section, mounting, insulation temperature rating, and surrounding airflow. Leave margin for hot enclosures and imperfect joints. Real assemblies are rarely as tidy as drawings suggest.
Estimate resistive heating with P = I²R, using RMS current for a repeating waveform when appropriate. For a simple pulse, calculate the energy as I²Rt, then consider how often that pulse repeats and how quickly the bar can cool. Resistance changes as copper warms, so a room-temperature calculation can understate operating losses. Include joint resistance too; a slightly loose connection may create a hot spot near a terminal. Small details matter. Compare the estimate with temperature measurements under representative load, using sensors near joints and the busbar’s center. If measured temperatures exceed expectations, revisit contact pressure, current assumptions, and airflow. The calculation is useful, but it is not the whole test.
Compare Copper Grades Using 1.68 × 10⁻⁸ Ω·m Resistivity at 20°C
For a CCS busbar, compare copper grades against a consistent 20°C reference. The stated 1.68 × 10⁻⁸ Ω·m value is commonly used for high-purity copper. IEC 60028 defines the 100% IACS benchmark as 1.7241 × 10⁻⁸ Ω·m, or 58 MS/m. These figures are close, but not interchangeable. Small difference. Real impact.
Copper Development Association data place C11000 copper at 100% IACS conductivity and high-purity C10100 near 101% IACS. That modest gain may matter in a compact assembly, but grade alone does not guarantee lower operating resistance. For example, a one-metre bar with a 20 × 3 mm cross-section calculates to about 0.28 mΩ using 1.68 × 10⁻⁸ Ω·m. The IACS reference gives about 0.29 mΩ. Check the actual material certificate and stated test temperature.
In practice, inspect the cut edge, thickness, and contact surfaces too. A poorly clamped joint can undermine a small conductivity advantage. Heat changes resistance, and bends or plating may affect the finished assembly. I would treat the headline resistivity as a screening value, not a selection verdict. That distinction is easy to overlook.
Check Insulation Clearance and Creepage Under IEC 60664-1
In a compact CCS busbar assembly, a few millimeters can separate reliable insulation from an avoidable failure. Clearance is the shortest path through air between conductive parts. Creepage is the shortest path along an insulating surface. They are different measurements, and one cannot replace the other.
IEC 60664-1 does not provide one universal spacing for every busbar. The required distances depend on factors such as working voltage, rated impulse voltage, pollution degree, and the insulator’s material group. Check the actual design conditions before setting dimensions. A rib or slot may lengthen a surface path, but it does not necessarily improve the air gap. Measure between the nearest exposed conductive edges, including fasteners and terminal features. Small details matter.
A drawing can look generous while a molded corner creates a shorter creepage route. That is easy to miss. Also consider altitude: clearances may need adjustment for installations above 2,000 meters. Keep tolerances, assembly movement, dust, and moisture in view, not just nominal CAD dimensions. If a coating is used, do not assume it changes the insulation requirements without confirming its suitability and process control. Validate critical distances on production-representative parts, then review them when materials or tooling change. One awkward lesson: a neat drawing is not proof of a safe assembly.
7 Tips for Choosing the Right CCS Busbar
Check insulation clearance and creepage under IEC 60664-1
How to read this chart: The bars show indicative creepage reference values for pollution degree 2 and material group IIIa. Confirm the applicable IEC 60664-1 edition, operating conditions, and insulation requirements for your design.
Clearance is a separate check: Determine it from the required impulse withstand voltage, overvoltage category, field conditions, and altitude. Creepage follows the working voltage, pollution degree, and insulating material group; do not use one spacing value as a substitute for the other.
Validate Busbar Vibration Resistance Against ISO 16750-3
A CCS busbar may look rigid on a bench, yet road vibration can loosen joints, fret contact surfaces, or fatigue supports. ISO 16750-3 defines mechanical-load tests for vehicle electrical and electronic equipment, including vibration and shock. It does not give every busbar one universal pass level. The test profile should match the intended mounting location, vehicle environment, and assembly.
Test the busbar with its real insulators, fasteners, and representative cable connections. Check multiple axes, then inspect for cracks, movement, and contact-resistance changes. Record joint temperature and fastener condition before and after testing. Small details matter. A stiff laboratory fixture can hide a weak support point; that is easy to miss. IEA’s Global EV Outlook 2024 reported more than 14 million electric-car sales in 2023, about 18% of global car sales, underscoring the scale of electrified-vehicle production. That growth makes repeatable qualification useful, but market figures do not replace vehicle-specific vibration testing. Keep the test setup and measured results with the design record.